Author: Alice Butler, Farmanco
Verge technology provides a new way of looking at the effect of changes such as machinery selection, route planning etc. on the efficiency of farming operations. Using the Verge platform to model the impact of different seeder widths and the addition of section control gave the following key insights:
- There was a 31% efficiency gain changing from 12 m to 18 m seeding width, and a 23% efficiency gain changing from 18 m to 24 m.
- Larger seeding machines produce greater overlap, especially in complex paddocks.
- Higher input costs (e.g. within the high rainfall region) reduced payback time on the purchase of section control.
Farmanco is part of a three-year GRDC project titled On Farm Operations Optimisation, led by Verge Technologies and the Australian Controlled Traffic Farming Association (ACTFA). This project works alongside consultants and growers across Australia, as well as the Verge development team based in Canada.
Using the Verge online platform (www.vergeag.com) the project focuses on improving efficiencies by allowing growers to upload their paddock boundaries and current machinery fleet data, building their digital farm, and from there allowing some of the following analyses:
- Equipment Fleet and Farm optimisation: Enhance machinery investment planning by designing the right sized equipment fleet based on paddock shape, terrain and other spatial attributes.
- Growing season Pathway Planning: Determine optimal AB lines to maximise machinery efficiency, reduce idle time and fuel consumption, plan pathways to minimise crop damage and soil compaction, and assess the benefits of controlled traffic farming.
- In-Paddock Operations Logistics Planning: Evaluate optimal refill points or grain bin placement (e.g. for grain, fertiliser, fuel) based on unit capacities of equipment operating in the paddock.
- Analytical Tools for Cost- Benefit Analysis


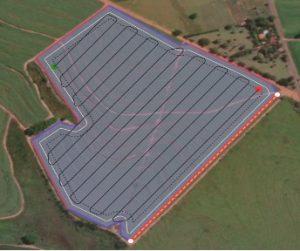
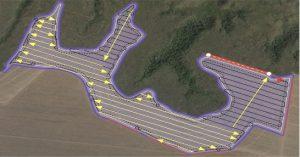
Figure 1. Verge pathway planning software works out the most efficient direction of travel and allows you to split paddocks so that they can be operated in different directions.
After speaking to growers, some of whom have been using CTF for over 10 years, the idea of changing runlines is not appealing, however the idea of transitioning from runlines to predefined routes or paths is attractive. This takes the guesswork out of where to start, which way to turn and how to navigate tricky, small sections of the paddock, letting you plan exactly how a machine, or multiple machines, will move through a paddock using the most efficient route. Once routes and the direction are set, the next most flexible point to optimise is the locations of refill and unloading points and access to these points via laneways. Different options can be analysed in the software before being executed in the paddock.
The platform is also very useful for comparing different machinery widths, such as 12 m, 18 m and 24 m seeders, and at what point in time section control pays for itself on your farm. In the example below we compare two farms in the Albany Port Zone, one high rainfall and the other located in the medium rainfall zone. We used a capital cost of $55,000 to upgrade a machine to have section control for this analysis.

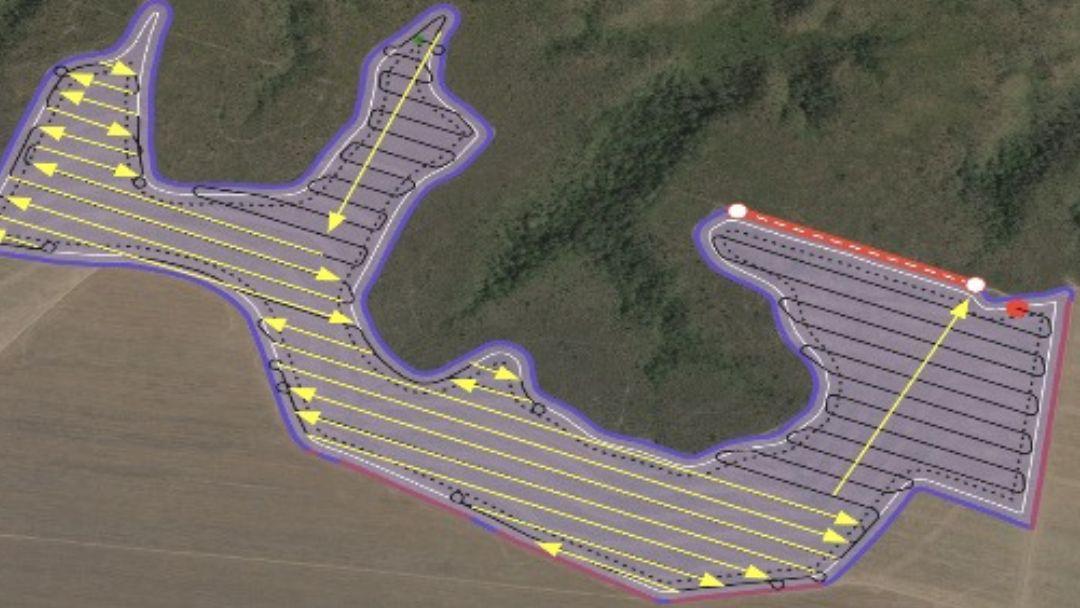
Figure 2. A 12 m seeder using 3 outside laps and 2 interior laps gave an estimated paddock overlap area of 9.05 ha (3.86%).
High Rainfall
The high rainfall farm is 5,894 ha and for this example we used an average seeding product (seed, fertiliser and ag chem) cost of $245/ha.
The high rainfall farm overlap estimate, displayed in Fig. 3, was 2.5%, 3.7% and 4.9% for 12 m, 18 m and 24 m seeding machines, respectively. This compared with 0.7% overlap for 3 m section control on the most efficient runlines. The overlap product cost (i.e. cost of seed, fertiliser etc. wasted by overlap) without section control was $35,915/year for 12 m, $54,040/year for 18 m and $71,268/year for 24 m, compared to $9,807/year across all machines with 3 m section control.

Figure 3. % overlap for different width seeders (12 m, 18 m, 24 m) and overlap product costs ($/year) with and without 3 m section control, on a 5,894-hectare high rainfall farm in the Albany Port Zone.
By comparing overlap costs over multiple years, we can start to understand the time frame to payback for section control at $55,000 for one machine or $110,000 for two machines (Fig. 4.). In the high rainfall environment, it would take three years for the 12 m machine to justify section control on one machine, and five years for two machines. After five years the cost of product overlap for a 12 m machine without section control is $179,575 compared to the cost of upgrading two 12 m seeding machines plus annual 3 m overlap product costs of $159,034. At 18 m, the payback time for upgrading to section control it would be two years for one machine and three years for two machines. At 24 m, payback would be just over one year for one machine and two years for two machines.

Figure 4. Cumulative overlap product costs ($/year) for 12 m, 18 m and 24 m seeders over 8 years on a high rainfall farm in the Albany Port Zone, compared to section control capital ($55,000) plus overlap product costs.
Medium Rainfall
The medium rainfall farm is 4,345 ha with lower input costs of $172/ha for seed, fertiliser and ag chem. This farm had less overlap, due to larger, less complex paddocks with fewer internal structures.
The medium rainfall farm had 1.8% overlap at 12 m, 2.6% overlap at 18 m and 3.4% overlap at 24 m, costing $13,459/year, $19,164/year and $25,145/year, respectively (Fig. 5.). By purchasing section control, the overlap could be reduced to 0.5% costing $3,612/year in inputs in the most efficient system of working, plus the cost of upgrading to section control.

Figure 5. % overlap for different width seeders (12 m, 18 m, 24 m) and overlap product costs ($/year) with and without 3 m section control, on a 4,345-hectare medium rainfall farm in the Albany Port Zone.
When we compare the cumulative seeding product costs due to overlap, we can work out the approximate timeframe to payback for section control. A single 12 m machine takes six years to payback section control and greater than eight years on two machines (Fig. 6.). At 18 m, it takes four years to payback for one machine and eight years for two machines, while at 24 m, it will take three years for one machine and six years for two machines.

Figure 6. Overlap product costs ($/ha) for 12 m, 18 m and 24 m seeders over 8 years on a medium rainfall farm in the Albany Port Zone, compared to section control capital ($55,000) plus overlap product costs.
These real farm examples look at the most efficient operation of the paddock and it is likely under time pressure and with casual staff the overlap percentages could be higher.
Time efficiency
There are obviously benefits to increasing the width of seeding machinery in terms of time and productivity. A default working speed of 8.85 km/hour and turning speed of 5.63 km/hour was used to look at the time and productivity differences between different seeding machinery widths over the high and medium rainfall farm (Fig. 7.). This was only done for a single machine and refill time was not included in this assessment.

Figure 7. Time (hours) and productivity (ha/hour) at different seeding machinery widths, with one machine, on a high and a medium rainfall farm in the Albany Port Zone.
A 12 m machine would take 599 hours to cover the 5,894 ha high rainfall farm at the default operating and turning speeds. The same area would be covered in 414 hours by an 18 m machine while a 24 m machine would require 321 hours. This equates to a productivity of 10 ha/hour for a 12 m machine, 14 ha/hour for an 18 m machine and 18 ha/hour for a 24 m machine.
The same seeders operating on the 4,345 ha medium rainfall farm would take 434 hours (12 m), 296 hours (18 m) and 228 hours (24 m). Productivity would be 10 ha/hour (12 m), 15 ha/hour (18 m) and 19 ha/hour (24 m).
Increasing seeder width from 12 m to 18 m gave efficiency gains of 31% and 32% for the high and medium rainfall farms, respectively. Upgrading from 18 m to 24 m gave a 23% efficiency gain on both farms.
Small efficiency gains at scale can make large differences to the amount of seed, fertiliser, diesel and ag chem used, as well as time spent in a paddock. Using pathway planning software, such as www.vergeag.com, allows you to analyse operations on farm, identify where efficiency gains and trade-offs might be, and presents a clearer transition to autonomous farming.

